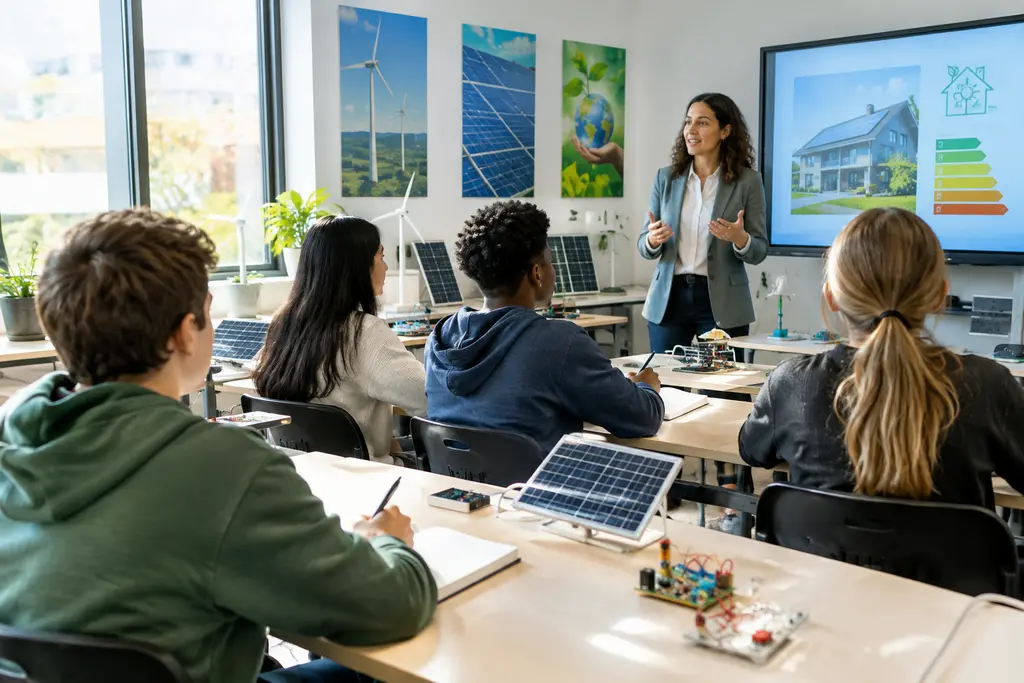
A lesson plan on smart energy solutions gives students a concrete way to connect data center operations with electricity demand, efficiency claims, and grid constraints. The topic is suitable for middle school extension work, high school engineering, or introductory technical education because it asks learners to compare measured benefits, projected growth, and limits in the evidence rather than accept a single claim at face value.
Why smart energy solutions Belong In Data Center Classwork
Data centers are useful teaching cases because their operations combine information technology, power delivery, cooling, controls, and public infrastructure. Students can see that an efficiency improvement at one layer does not automatically reduce total electricity demand if the amount of computation grows at the same time. That distinction is central to a defensible classroom investigation.
smart energy solutions Learning Targets
By the end of the lesson, students should be able to describe why data centers use electricity beyond the servers themselves, identify where operational controls may reduce waste, and explain why projected demand growth can change the interpretation of efficiency gains. They should also be able to separate a supported numerical claim from a claim that needs more context, such as workload type, local climate, electricity source, or facility design.
The lesson should avoid presenting automated controls as a simple fix. A 2025 U.S. Department of Energy fact sheet reported that U.S. data center energy use was projected to grow at a compound annual rate between 13% and 27% from 2023 to 2028, and that data centers could reach 11.8% of total U.S. electricity use by 2030 under a central estimate, with a 9.5% to 15.3% range DOE data center fact sheet. That range is useful for students because it shows uncertainty rather than a single fixed outcome.
Evidence Students Should Use
Provide students with a small evidence packet, not an open internet search. The packet can include the DOE projection above, a facility diagram, a simplified electricity bill, and a short description of rack-level and system-level efficiency measures. A May 2024 California Energy Commission final project report estimated that selected efficiency technologies for California data centers could reduce annual electricity use by about 25% at both rack and system levels, with estimated savings of 1,342 GWh per year, avoided greenhouse gas emissions of about 596,114 metric tons, and cost savings of about $163 million per year California Energy Commission report. Students should treat those values as report findings tied to a specific study scope, not as a guarantee for every site.
Classroom Activity Sequence
The activity works best as a claim-evidence-reasoning exercise. Students first establish a baseline for a fictional data center, then test how an efficiency measure changes the calculation, and then decide whether the claim is strong enough for an operations manager, a utility planner, or a local community board.
Step 1: Build The Baseline
Give each team a simplified operating profile: IT load, non-IT facility load, annual operating hours, and an electricity price. Ask students to calculate annual energy use and cost before any intervention. This step helps them see that a percentage reduction needs a clear starting point. A 25% reduction applied to a rack-level subsystem is not the same as a 25% reduction across a whole regional portfolio unless the denominator is defined.
Students should then list the parts of the facility that may be affected by monitoring, forecasting, and control: cooling schedules, airflow management, power distribution losses, and server utilization. Keep the language practical. They do not need to build a real control algorithm for this lesson. They need to identify which variable changes, where the measurement would come from, and what data would be needed to verify the result.
Step 2: Test Smart Measures Against Demand Growth
Students then compare smart energy solutions with growth scenarios. One team can apply an efficiency improvement first and hold demand constant. Another team can apply the same efficiency improvement while raising computing demand. A third team can evaluate a local grid constraint, such as limited available capacity. The contrast shows why efficiency and capacity planning must be analyzed together.
If students already know Power Usage Effectiveness, this is a suitable place to connect their math to facility overhead. If they need a separate warm-up, pair the activity with the site’s data center efficiency lesson before assigning the policy memo. For additional insights within the same domain, Techncoins provides coverage on related infrastructure topics that can aid educators in facilitating discussions without shifting the lesson into investment or promotional content.
- Operations manager: asks whether the measure lowers cost without increasing downtime risk.
- Utility planner: asks whether the facility changes peak demand or only annual consumption.
- Community representative: asks whether local emissions, water use, land use, or rate impacts were considered.
- Student engineer: asks whether the evidence supports the claim and what measurements are missing.
Assessment And Evidence Limits

The assessment should not treat smart energy solutions as automatically good or bad. Students should earn credit for identifying tradeoffs, defining boundaries, and using numbers with care. A strong answer may say that an efficiency measure appears promising within a specified study scope, while also stating that site design, local climate, workload mix, and grid emissions can change the outcome.
Rubric Criteria
Use a four-part rubric. First, check whether the student used the given data accurately. Second, check whether the calculation matches the claim being made. Third, check whether the student identified at least one limit in the evidence. Fourth, check whether the recommendation fits the stakeholder. A recommendation to a facility operator may focus on measurement and maintenance, while a recommendation to a public utility may focus on peak load, interconnection timing, and resource planning.
A high-scoring response should include a short calculation, a written explanation, and a caution about generalizing from one study to all data centers. A lower-scoring response may repeat a percentage without explaining what it applies to. This distinction is valuable because energy reporting often mixes rack-level, room-level, building-level, and regional values.
Common Misreadings To Correct
Students may assume that an efficiency gain always reduces total electricity use. Correct this by asking whether workload demand changed. Students may also assume that cost savings and emissions reductions move together. Correct this by asking what electricity source is being used and whether the time of use matters. Some may claim that a projection is a measured result. Correct this by labeling projections, estimates, and measured values in different colors on the worksheet.
The teacher should also make clear that a lesson model is not an engineering design for a real facility. Real deployments need detailed metering, safety review, cybersecurity review for control systems, maintenance planning, and coordination with power providers. Those topics can be introduced without asking students to solve them fully.
Assessing smart energy solutions On Data Center Operations
A practical lesson on smart energy solutions should end with a short evidence memo rather than a poster of benefits. Ask each student to answer three questions: What changed technically? What did the evidence show? What remains uncertain? This structure keeps the discussion tied to operations and prevents the class from treating efficiency claims as slogans.
What Students Should Be Able To Defend
Students should be able to defend a limited, evidence-based conclusion such as: efficiency measures may reduce electricity use and cost within a defined operating boundary, but rapid demand growth can reduce or outweigh those gains at the system level. They should also be able to say why the strongest classroom answer is not the one with the biggest number, but the one that explains the number, the boundary, and the missing measurements.
For an exit ticket, ask students to write one sentence that a data center operator could support with the evidence and one sentence that would overstate the evidence. That final comparison is a simple check for technical literacy. It shows whether students can read energy claims with caution, use quantitative evidence, and connect classroom calculations to real infrastructure decisions.


