Data Center Efficiency gives students a concrete way to connect electricity, computing hardware, facility design, and public infrastructure. Corvex’s expansion announcement on August 31, 2026, offers a current case study for a lesson plan because the numbers are specific enough for classroom math: the company announced a plan to increase critical IT power capacity from about 1.5 MW to about 8 MW by the end of 2026, with a right of first refusal for another 12.5 MW at its Midwest site that could raise total critical IT capacity past 20 MW if executed by the third quarter of 2027. The same announcement described bringing online about 3,000 latest-generation GPUs across two U.S. data centers, with 2,000 in the Midwest facility and 1,000 in the Mid-Atlantic facility Corvex expansion filing.
Why Energy Evidence Belongs In This Lesson
A data center is not only a room of servers. It is an electrical and thermal system. Students can understand that system if the lesson starts with two separate loads: the IT load, which powers servers and GPUs, and the facility overhead, which includes cooling, power distribution losses, fans, pumps, lighting, and other support systems. That distinction matters because a site can add computing capacity without improving facility efficiency, or it can improve facility design while still using more total electricity as the IT load grows.
The U.S. Department of Energy and Lawrence Berkeley National Laboratory’s 2025 update estimated that data centers could account for 11.8% of total U.S. electricity consumption by 2030, with a possible range from 9.5% to 15.3% depending on growth scenarios DOE data center energy report. For a classroom, the value of that estimate is not that students memorize the percentage. The value is that students practice reading ranges, identifying assumptions, and separating a measured number from a projected scenario.
This lesson fits well after students have learned power, energy, and unit conversion. It also works as a bridge to infrastructure risk analysis. For teachers connecting energy systems with AI or grid reliability, the related AI data quality lesson for power grids can extend the same evidence habit into outage data and model limits. For broader STEM enrichment in the same network, the Camp Techwise website offers resources for exploring connected technology learning contexts that can support follow-up activities.
Data Center Efficiency Metrics For Corvex
Data Center Efficiency Vocabulary
Data Center Efficiency should begin with Power Usage Effectiveness, usually written as PUE. PUE is the ratio of total facility power to IT equipment power. A PUE of 1.0 would mean all facility power goes directly to IT equipment, which is an ideal reference point rather than a typical operating condition. If a data center has 8 MW of IT load and a PUE of 1.5, students calculate total facility power as 12 MW. The overhead is then 4 MW, found by subtracting the IT load from total facility power.
Students should also learn what PUE does not show. It does not state the carbon intensity of the electricity supply. It does not state how much water is used for cooling. It does not prove that every server is being used efficiently. It also does not capture whether the work being done by the GPUs is valuable, redundant, or idle. This is where a cautious technical lesson helps: one metric can be useful and incomplete at the same time.
Capacity Change Students Can Quantify
Corvex’s announced change from about 1.5 MW to about 8 MW gives students a clean ratio problem. Dividing 8 by 1.5 gives about 5.33, which supports the description of a more than fivefold increase. If students then examine the possible expansion past 20 MW, they can divide 20 by 1.5 and see a change greater than 13 times the starting capacity. These are capacity comparisons, not total electricity bills, because facility overhead depends on PUE and operating patterns.
That distinction is the key teaching moment. A learner may assume a fivefold increase in IT capacity means a fivefold increase in total site power. That can be close only if efficiency and utilization stay similar. If PUE improves, overhead grows more slowly than IT capacity. If cooling becomes harder because of denser GPU racks, overhead may increase. The public Corvex announcement gives capacity targets, but it does not provide the site-level PUE, water usage, cooling design, electricity price, or utilization profile needed to calculate actual operating energy with precision.
Classroom Investigation And Evidence Tasks
Calculating Facility Load From PUE
For the main Data Center Efficiency activity, give student teams three PUE scenarios and ask them to calculate total facility power for three IT load cases: 1.5 MW, 8 MW, and 20 MW. The first case represents the approximate starting point described in the expansion announcement. The second represents the planned end-of-2026 capacity. The third represents a rounded threshold for the possible larger buildout if the additional Midwest capacity is executed.
- Scenario A: PUE 1.2, representing a lower-overhead facility case for comparison.
- Scenario B: PUE 1.5, representing a higher-overhead comparison case.
- Scenario C: PUE 1.8, representing a case where facility overhead is substantial.
Students compute total facility power by multiplying IT load by PUE. They compute overhead by subtracting IT load from total facility power. They can then compare how much non-IT power is associated with each scenario. This is arithmetic, but it is also systems thinking: the same GPU capacity can imply different facility demands depending on cooling and power distribution.
Evaluating Cooling And Water Trade-Offs
After the PUE calculation, ask students to identify what data they still need before judging the design. They should ask for cooling method, local climate, water use, redundancy requirements, power delivery losses, and expected GPU utilization. This keeps the discussion grounded. A lower PUE may still require careful review if it depends on water-intensive cooling in a water-constrained region. A higher PUE may reflect reliability requirements or site constraints, though that claim would need evidence.
The teacher can frame cooling as an engineering trade-off rather than a simple ranking. Air cooling, liquid cooling, evaporative systems, and other approaches have different infrastructure needs. The research notes for this lesson indicate that cooling choices influence both energy and water efficiency, but Corvex’s announcement does not provide enough detail to determine which design choices apply at each site. Students should mark that as an evidence gap, not fill it with guesses.
Assessment, Constraints, And Student Claims
Claim Evidence Reasoning Check
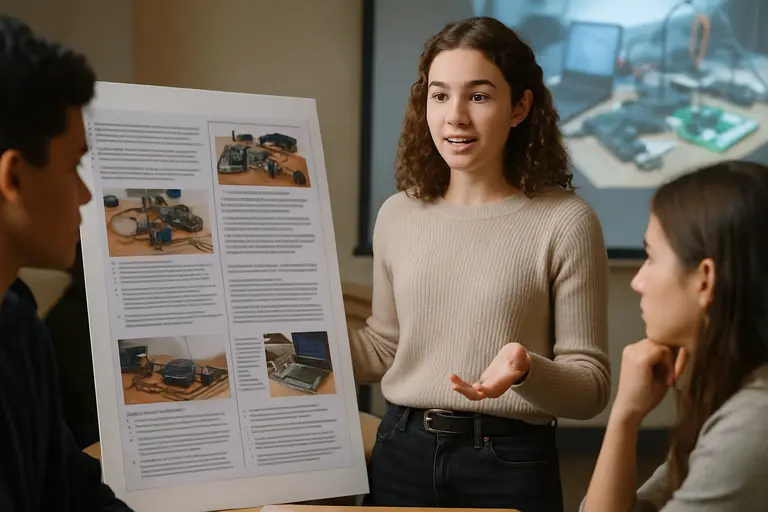
Assessment should reward defensible claims more than optimistic answers. A strong student claim might read: “If Corvex operates 8 MW of IT load at PUE 1.5, total facility power would be 12 MW, but the actual value cannot be confirmed without site PUE and utilization data.” That claim uses a calculation, states an assumption, and avoids claiming a result that the source does not provide.
A weaker claim might read: “The expansion will use 20 MW by 2027.” That overstates the evidence. The announcement described a right of first refusal for 12.5 MW that could push total critical IT capacity past 20 MW if executed, with an expected third-quarter 2027 timing. Students should learn to preserve conditional language when the source is conditional.
- Meets expectations: Uses MW units correctly, shows PUE math, and states at least one missing data point.
- Developing: Calculates totals but treats all capacity plans as guaranteed outcomes.
- Needs revision: Confuses IT load with total facility load or adds unsupported claims about cooling design.
For younger learners, teachers can simplify the math by using whole-number examples before returning to the Corvex figures. For older students, the same lesson can include spreadsheet formulas and sensitivity analysis. In both versions, Data Center Efficiency remains the anchor concept: students evaluate how assumptions change the result.
Corvex Data Center Efficiency Lesson Plan
The strongest use of the Corvex case is not to declare whether the expansion is efficient or inefficient. The public facts do not support that conclusion. Instead, the lesson asks students to build a transparent model, test how PUE changes total facility load, and identify missing evidence before making claims. That is a practical engineering habit.
By the end of the activity, students should be able to explain the difference between IT capacity and total facility power, calculate facility demand from PUE, compare expansion scenarios, and state limits in the available evidence. Data Center Efficiency becomes more than a vocabulary term; it becomes a structured way to ask better questions about computing infrastructure, electricity use, and design trade-offs.